Most calculators are built for buyers. If you sell options for a living, you need a tool that thinks like you do — one where falling prices mean profits, not losses.
There’s a peculiar frustration that every options seller knows well. You open a generic P&L calculator, enter your trade details, and watch in mild annoyance as it shows you a loss when the underlying price drops. You have to mentally flip everything — remind yourself that this tool was built for someone on the other side of your trade.
I got tired of that. So I built one from scratch, designed entirely around the short seller’s perspective. This post walks through what it does, the logic behind it, and why getting this right actually matters for your trading discipline.
The Core Problem with Generic Calculators
When you sell an option — whether it’s a naked call, a covered call, a cash-secured put, or any short premium strategy — your payoff structure is the mirror image of the buyer’s. The buyer profits when the underlying moves in their favour. You profit when it doesn’t.
This sounds obvious, but most P&L tools are built from the long side. They show a green number when price rises and a red number when it falls. For a short seller, that’s backwards on most trades. You need a calculator where:
Price falls below strike → you see green. The option you sold expires worthless or loses value — you keep the premium and potentially close for a profit.
Price rises above strike → you see red. The option is now in the money against you. Your loss grows with every point the price moves above your strike.
“A tool that shows you loss when you’re actually winning isn’t just annoying — it erodes your confidence at exactly the wrong moment.”
This isn’t just a cosmetic issue. When you’re watching a live trade and your calculator is flashing red as the price falls in your favour, it creates a small but real cognitive dissonance. Over many trades, that adds up.
How the Calculator Works
The interface is deliberately simple. Three inputs, one vertical slider, and a live P&L display that responds in real time.
Calculator preview — sell ₹200 strike, 50 qty
Strike price
₹200.00
Sell value
₹10,000
% move
-15%
Realized P&L at ₹170.00
+₹1,500.00
price fell 15% below strike · profit zone
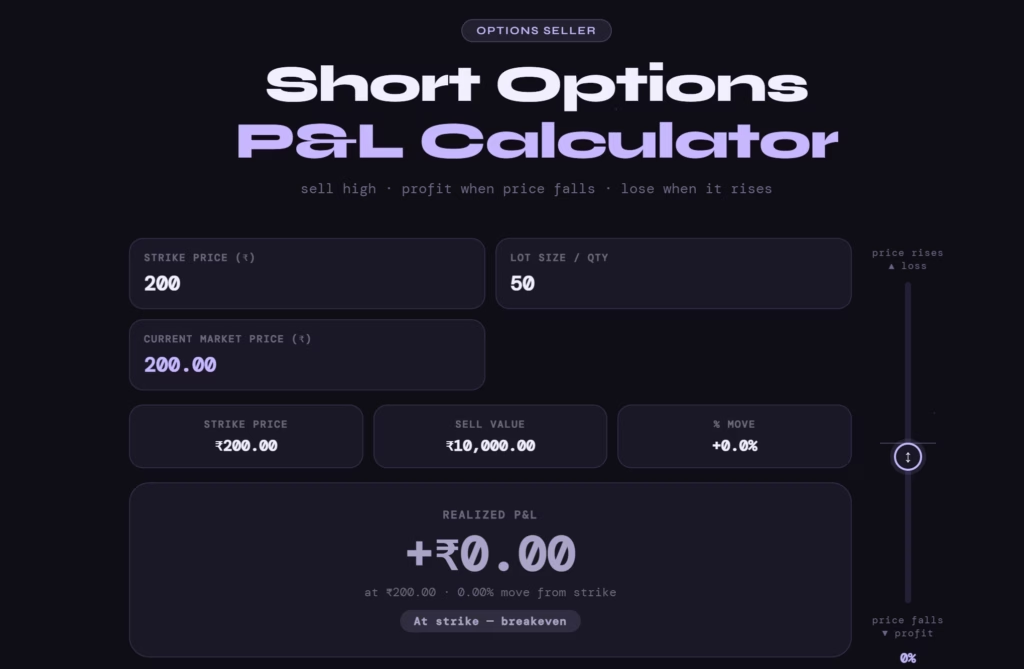
The three inputs
Strike price — the price at which you sold the option. This is your anchor. It’s the point where your P&L is zero, and it’s where the slider is centred by default.
Lot size / quantity — the number of units in your position. On Indian exchanges, options come in fixed lot sizes (e.g., Nifty is 25, BankNifty is 15). Enter your lot size here, or multiply by the number of lots you’ve sold.
Current market price — this is driven by the vertical slider, not a typed input. As you drag, the price updates live and the P&L recalculates instantly.
The vertical slider — a deliberate design choice
Most financial calculators use a horizontal slider. I went vertical for a specific reason: it maps naturally to how we think about prices on a chart. Price goes up on screen, price goes down on screen. When you drag the slider down, the price falls and your P&L turns green. When you drag it up, the price rises and your P&L turns red.
The slider covers a range of ±75% from your strike price — enough to model most realistic scenarios without the numbers becoming absurd. For deep OTM positions, this range is more than sufficient.
Design note
The fill bar on the slider itself also changes colour — green fills downward from centre when price falls, red fills upward when price rises. You get an at-a-glance read without even looking at the numbers.
The P&L formula
The core calculation is straightforward:
P&L = (Strike Price − Current Price) × Quantity
This is the raw mark-to-market P&L on a short position, ignoring premiums collected and brokerage (which you’d account for separately). When current price is below your strike, the result is positive. When it’s above, negative.
The stat cards show your sell value (strike × quantity — what this position was worth when you entered), your breakeven at strike, and the current % move from strike.
Scenario Planning — Where This Really Shines
The calculator becomes most useful not during live trades, but before you enter one. Run through scenarios quickly:
| Scenario | Strike | Current price | Qty | P&L |
|---|---|---|---|---|
| Price stays at strike | ₹200 | ₹200 | 50 | ₹0 |
| Price falls 10% | ₹200 | ₹180 | 50 | +₹1,000 |
| Price falls 30% | ₹200 | ₹140 | 50 | +₹3,000 |
| Price rises 10% | ₹200 | ₹220 | 50 | -₹1,000 |
| Price rises 25% | ₹200 | ₹250 | 50 | -₹2,500 |
Being able to visualise exactly what a 20% or 30% adverse move does to your book — before you’re in the trade — is the difference between a position size you can sleep with and one you can’t.
What It Doesn’t Do (And Why That’s Fine)
This calculator is deliberately not an options pricing model. It doesn’t use Black-Scholes, it doesn’t account for theta decay, implied volatility, or delta. It won’t tell you the theoretical value of your option at any given moment.
That’s intentional. What it does is answer a simpler, more immediately useful question: if the underlying is trading at X, what is the raw mark-to-market P&L on my short position? That’s the number that matters when you’re deciding whether to hold, hedge, or exit.
Coming next
A future version will add premium received as an input, which shifts the breakeven point and lets you model the exact net P&L including what you collected when you sold. It will also add support for spreads — short call + long call, short put + long put — where the payoff diagram changes shape entirely.
For now, keep it simple. Enter your strike, enter your quantity, drag the slider, and know your number.
The Psychological Edge
There’s something underrated about having the right frame. When your tools match your mental model, you make faster and calmer decisions. You don’t have to translate. You don’t have to remind yourself that red actually means good right now.
Options selling already demands a lot of psychological discipline — you’re collecting small, frequent wins while carrying the risk of occasional large losses. The last thing you need is a tool that fights you.
This calculator was built to think like a seller. Because that’s what we are.